PHP Debugging with Xdebug: Step-by-Step Guide for PhpStorm & VSCode
Tired of adding var_dump() and dd() statements everywhere? Xdebug transforms PHP debugging from guessing into precise, step-by-step investigation. See exactly what your code does, inspect variables at any point, and trace execution flow—all without modifying your code.
With FlyEnv's one-click Xdebug installation, you can set up professional debugging in minutes instead of hours of configuration file editing.
Why Xdebug Changes Everything
Traditional Debugging (Without Xdebug)
public function calculateTotal($items)
{
    $total = 0;
    foreach ($items as $item) {
        $price = $item->price;
        var_dump($price); // Remove this later
        $total += $price;
    }
    dd($total); // Die and dump
    return $total;
}
Problems:
- Cluttered code with debug statements
- Forget to remove debug code before committing
- Can't see intermediate values easily
- No execution flow visibility
Xdebug Debugging
public function calculateTotal($items)
{
    $total = 0;
    foreach ($items as $item) {
        $price = $item->price; // Set breakpoint here
        $total += $price;
    }
    return $total;
}
Set a breakpoint. Done. Inspect variables, step through loops, see the call stack—all in your IDE.
Installing Xdebug in FlyEnv
macOS & Linux: One-Click Installation
FlyEnv provides the fastest way to install Xdebug—no manual downloads or configuration hunting.
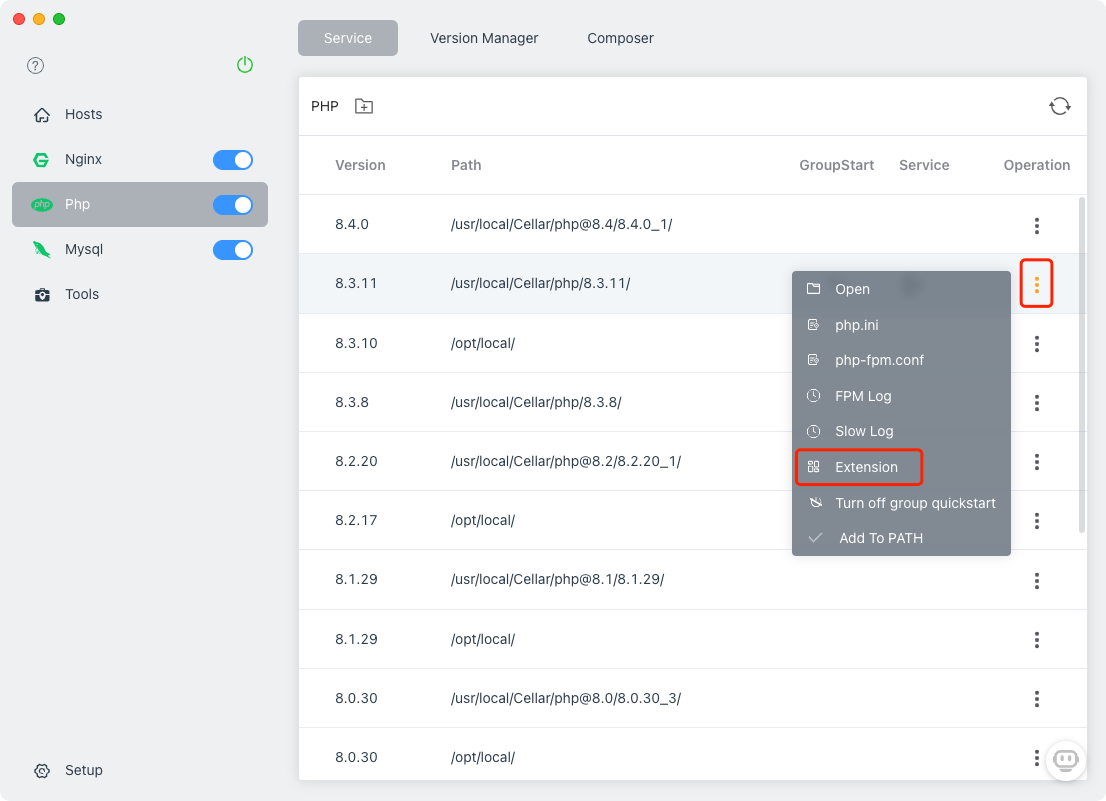
- Open FlyEnv → PHP module
- Select your PHP version
- Click "Extensions" tab
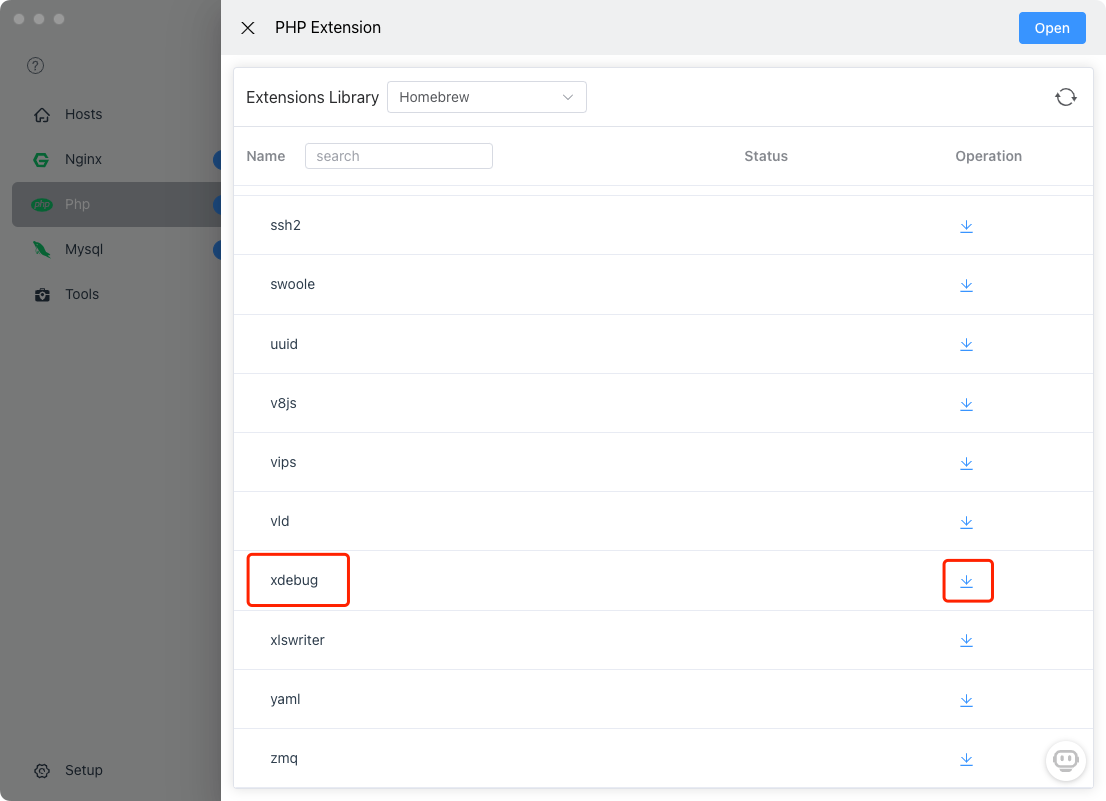
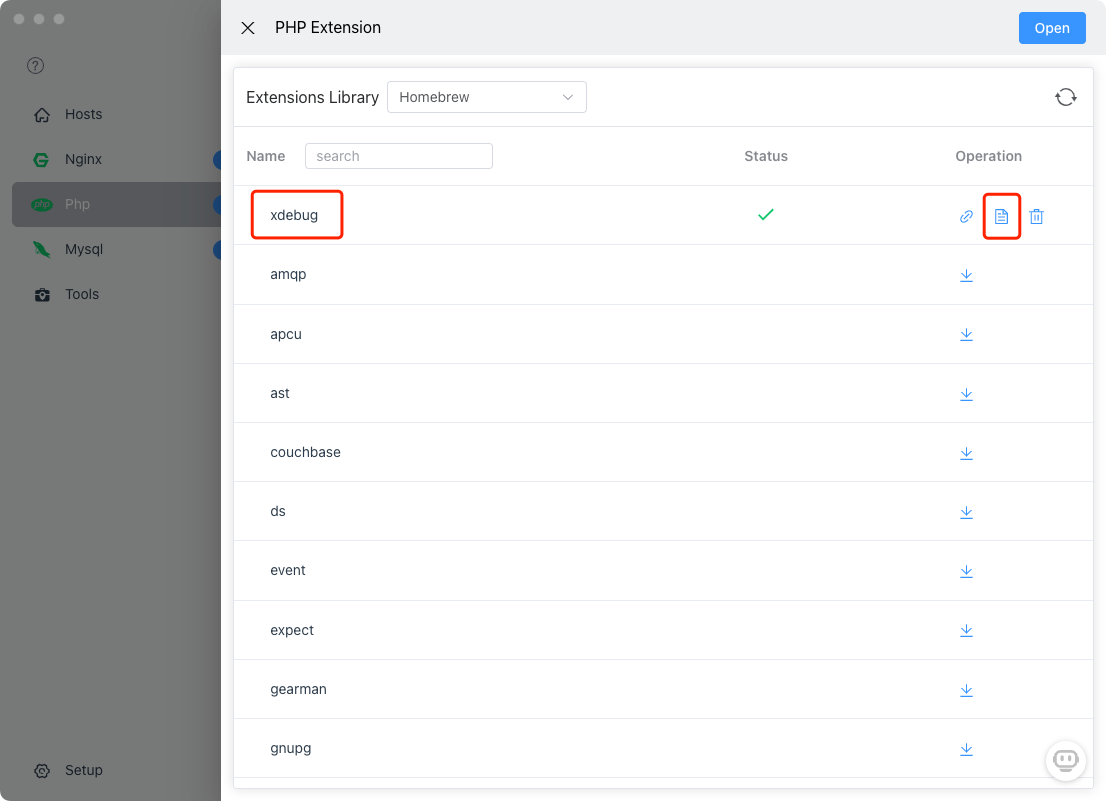
- Find Xdebug in the list
- Click Install
Xdebug downloads and installs automatically:
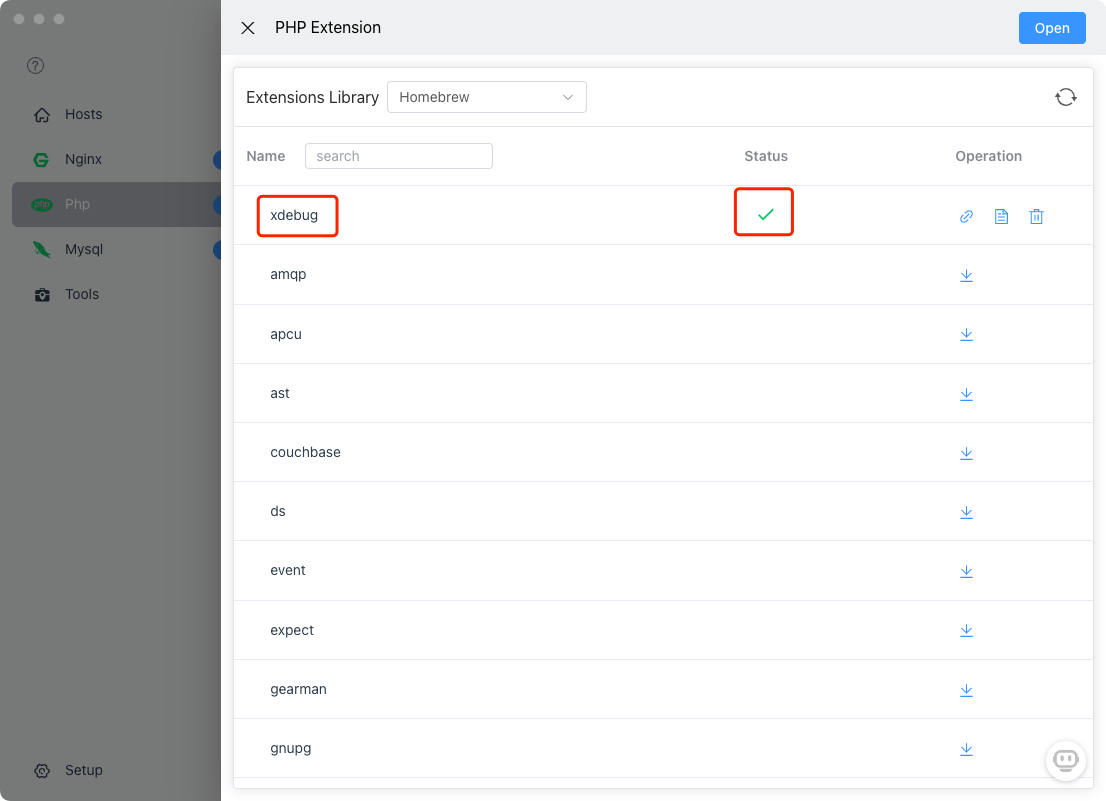
You'll see Xdebug listed as installed:
Windows: Manual Installation
Windows requires manual download (due to PHP binary compatibility):
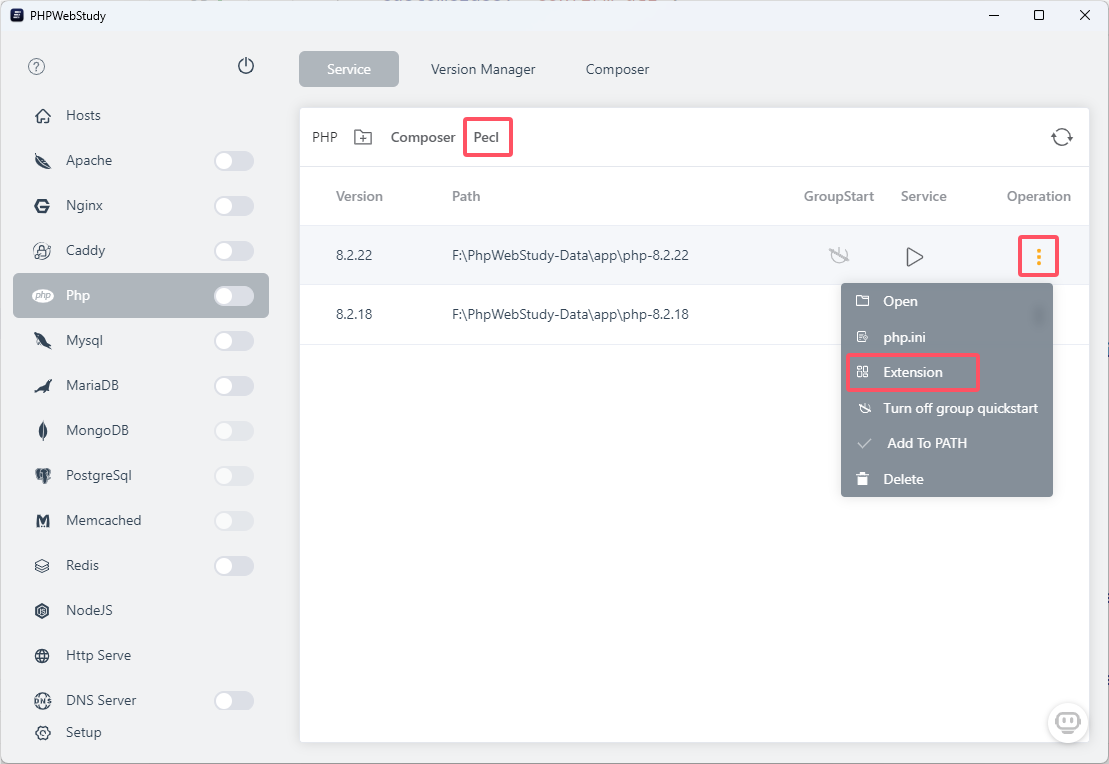
- In FlyEnv PHP module, click "Extension" button
- This opens the PECL website and your PHP extensions folder
- Visit https://pecl.php.net/package/xdebug
- Download the
xdebug.dllmatching your PHP version (TS/NTS, x64/x86) - Place
xdebug.dllin your PHP extensions folder (opened in step 2)
Tip: Use the Xdebug Wizard if unsure which DLL to download.
Configuring Xdebug
Quick Configuration with Templates
FlyEnv includes pre-configured Xdebug templates—no need to memorize settings.
- In PHP module, click "Conf" to edit
php.ini - Look for the Xdebug configuration section
- Click the template/copy button to insert recommended settings
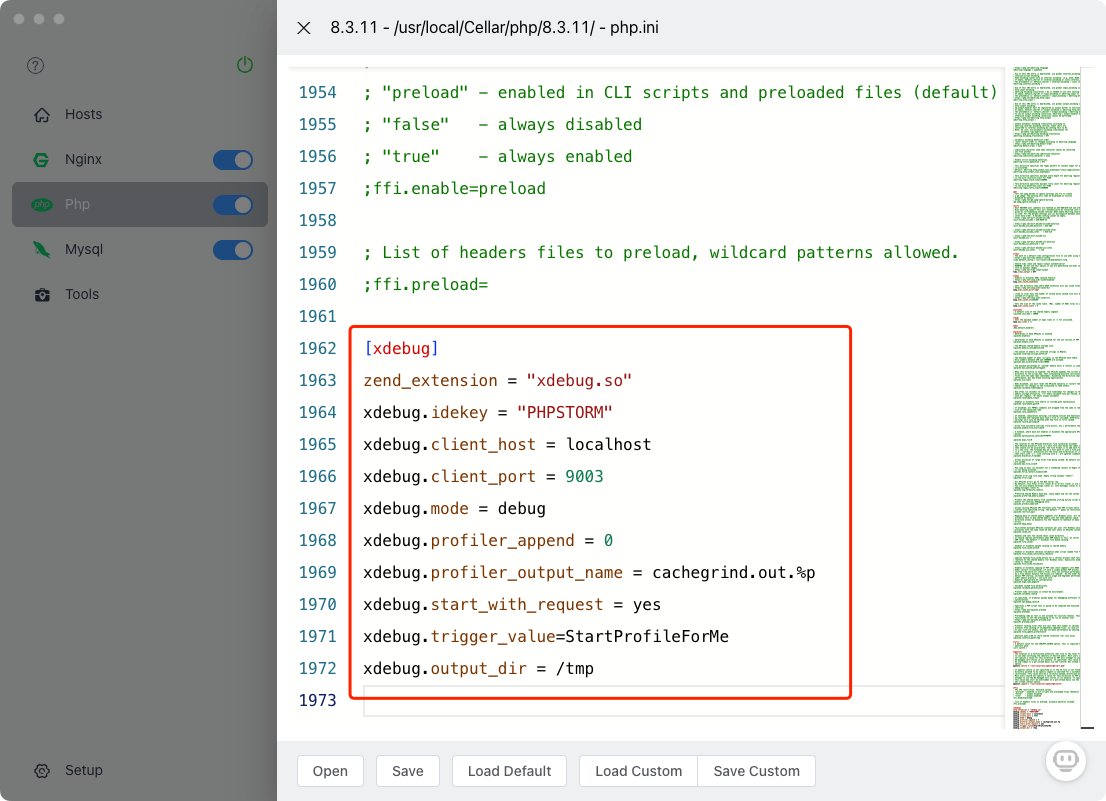
Recommended Xdebug Configuration
Paste this into your php.ini (macOS/Linux):
[xdebug]
zend_extension = "xdebug.so"
xdebug.idekey = "PHPSTORM"
xdebug.client_host = localhost
xdebug.client_port = 9003
xdebug.mode = debug
xdebug.profiler_append = 0
xdebug.profiler_output_name = cachegrind.out.%p
xdebug.start_with_request = yes
xdebug.trigger_value = StartProfileForMe
xdebug.output_dir = /tmp
For Windows, change the extension line:
zend_extension = "xdebug.dll"Configuration Explained
| Setting | Value | Purpose |
|---|---|---|
xdebug.mode | debug | Enable debugging (not profiling) |
xdebug.client_port | 9003 | Port IDE listens on (PhpStorm default) |
xdebug.idekey | PHPSTORM | Identifier for IDE matching |
xdebug.start_with_request | yes | Auto-start debugging on every request |
xdebug.client_host | localhost | Where IDE is running |
Restart PHP
After saving php.ini:
- Restart PHP service in FlyEnv
- Create a test file
phpinfo.php:php<?php phpinfo(); ?> - Access it in browser
- Search for "Xdebug"—you should see version info
IDE Configuration
PhpStorm Setup
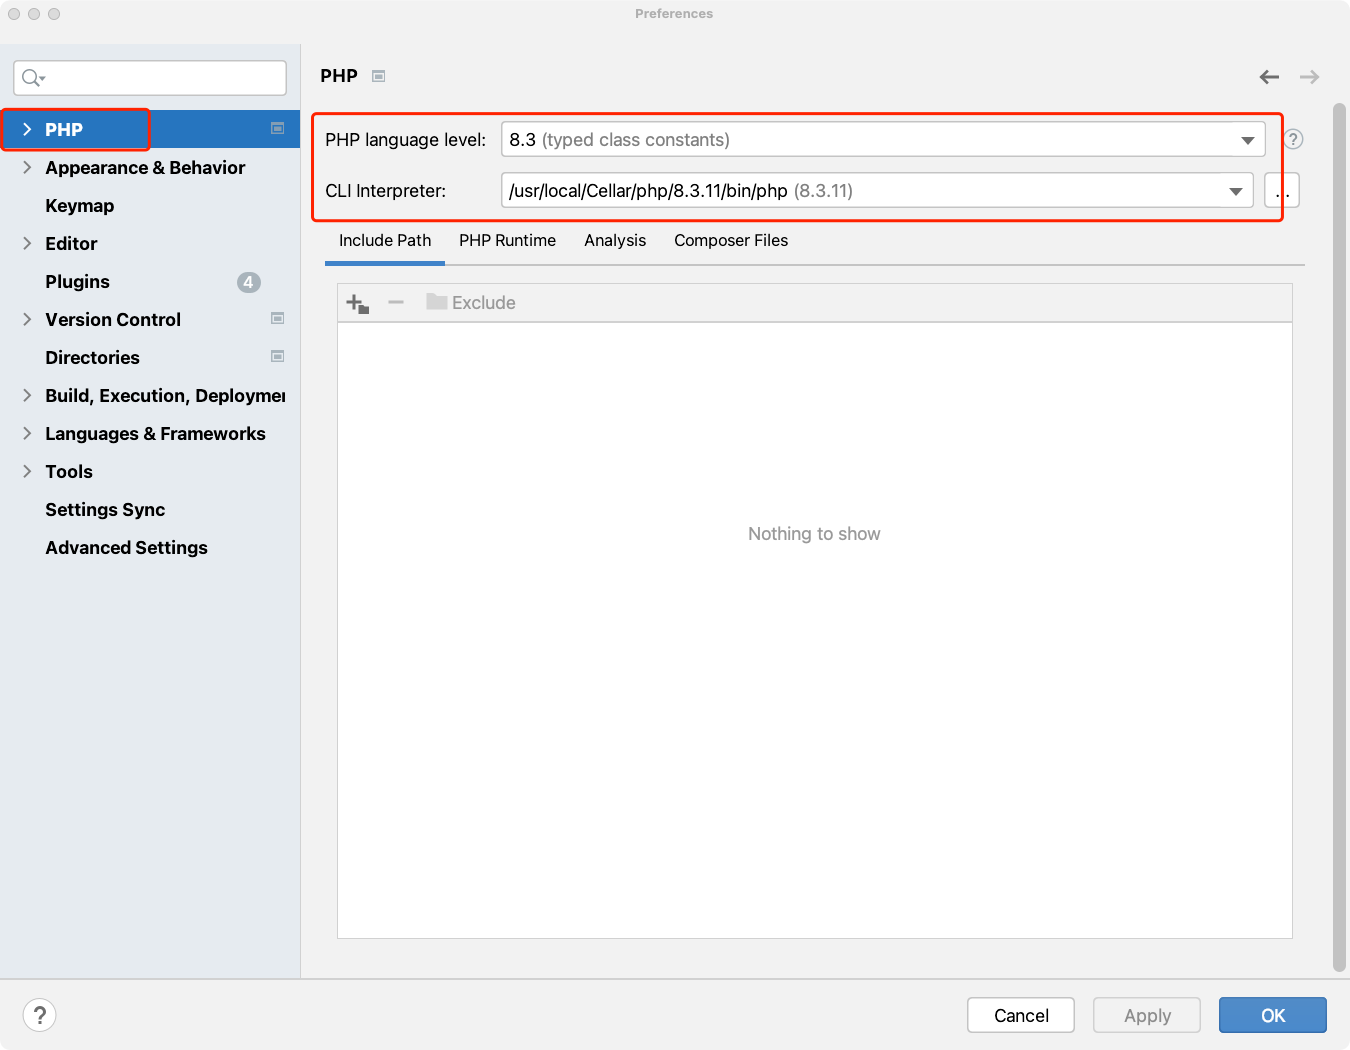
Step 1: Set PHP Interpreter
- Open Preferences → PHP
- Set CLI Interpreter to your FlyEnv PHP version
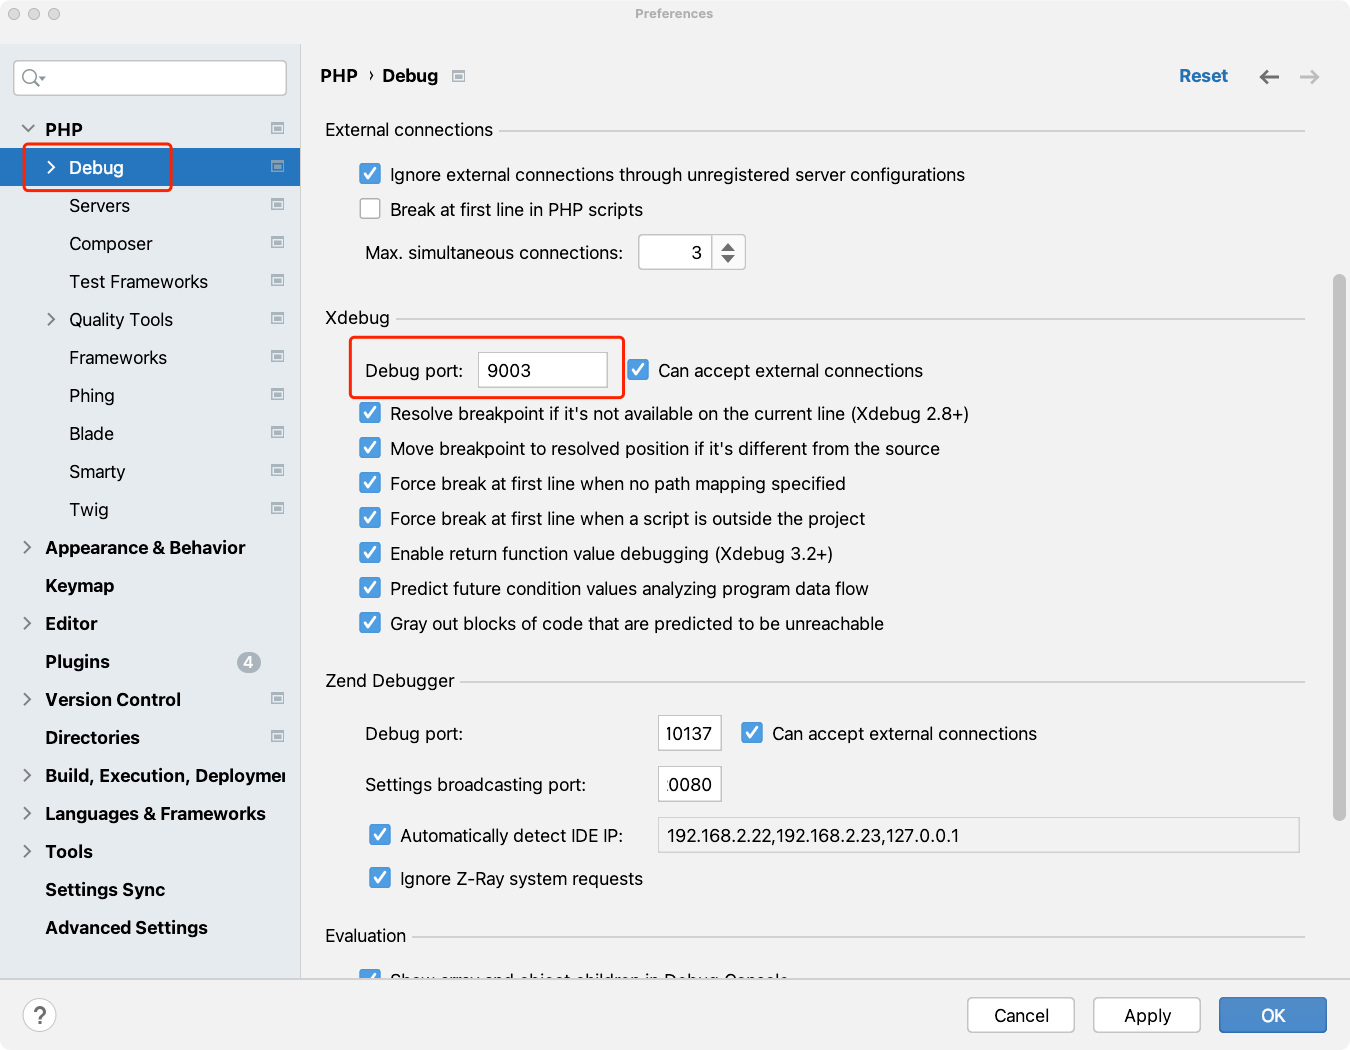
Step 2: Configure Xdebug Port
- Go to Preferences → PHP → Debug
- Set Debug port to
9003(matchingphp.ini)
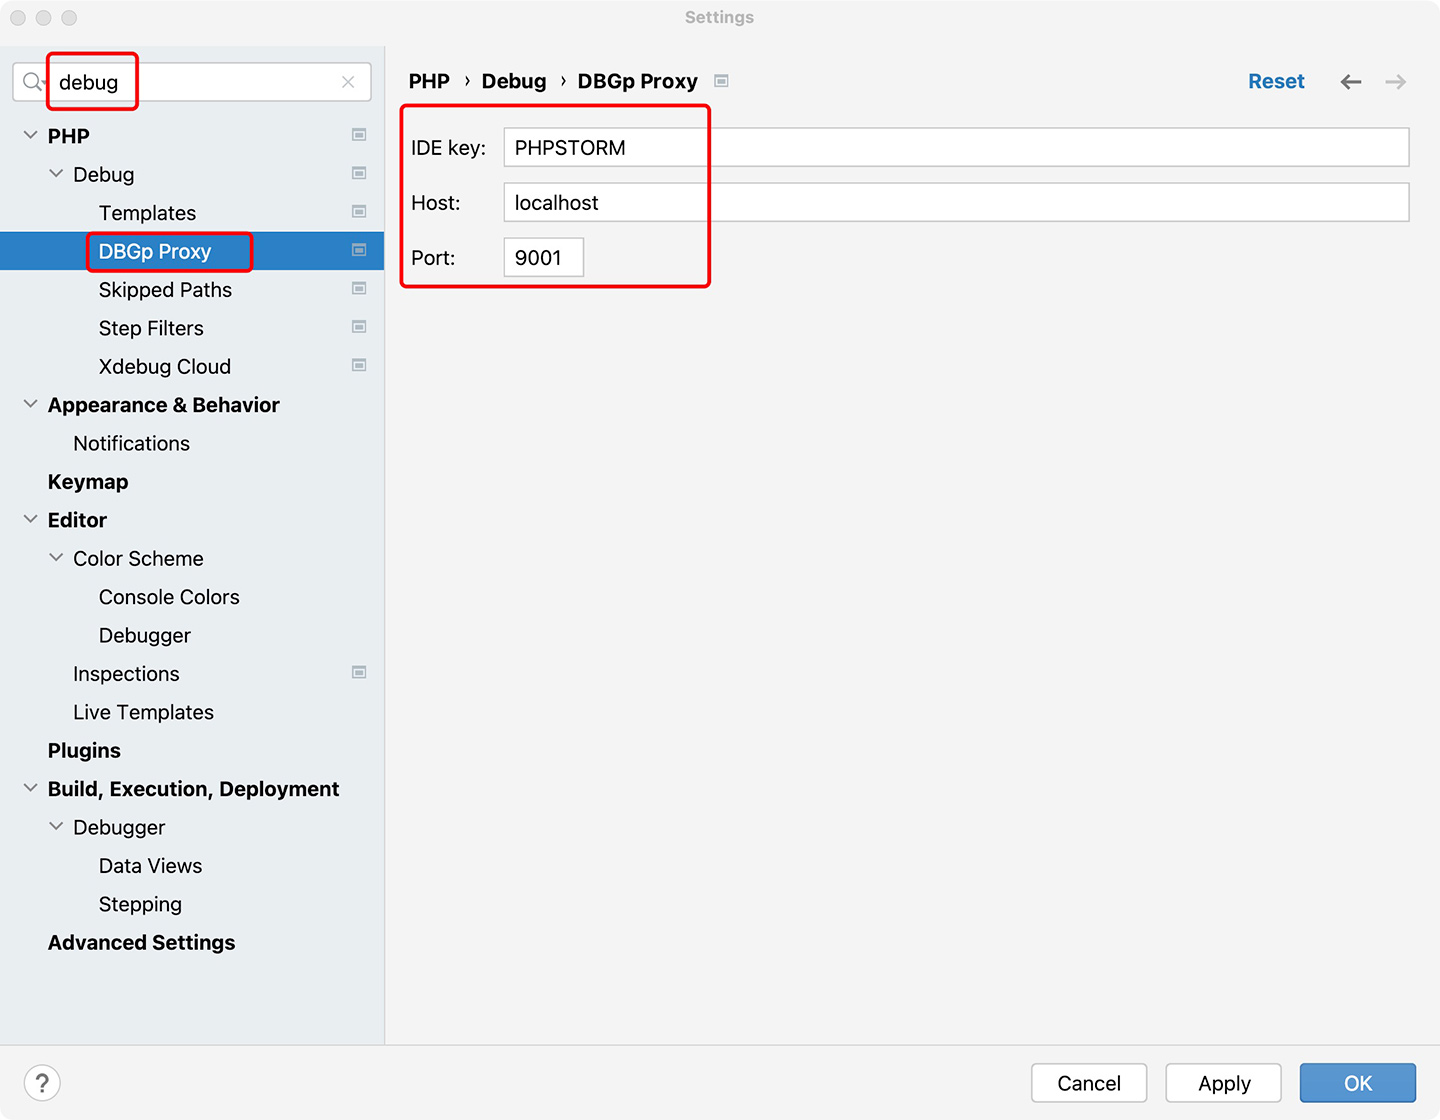
Step 3: Set IDE Key and Host
- In Debug settings, set:
- IDE key:
PHPSTORM(matchingphp.ini) - Host:
localhost
- IDE key:
Step 4: Start Listening
Click the "Start Listening for PHP Debug Connections" button (telephone icon) in the toolbar:
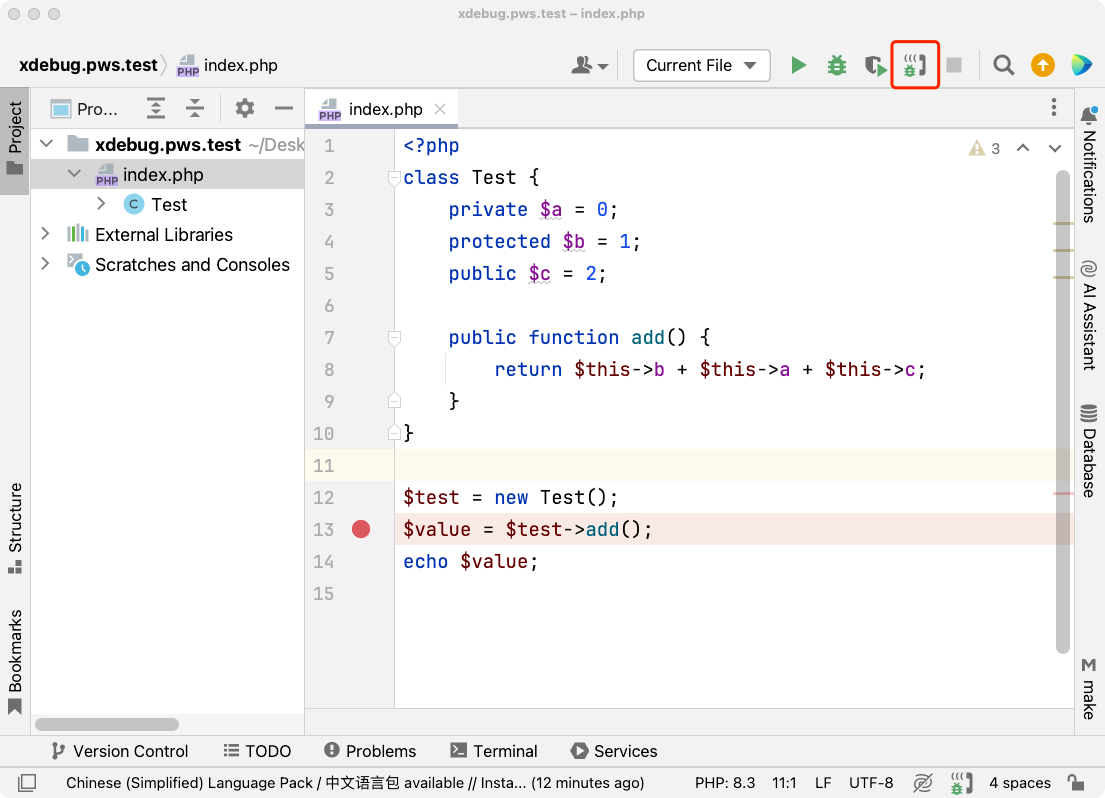
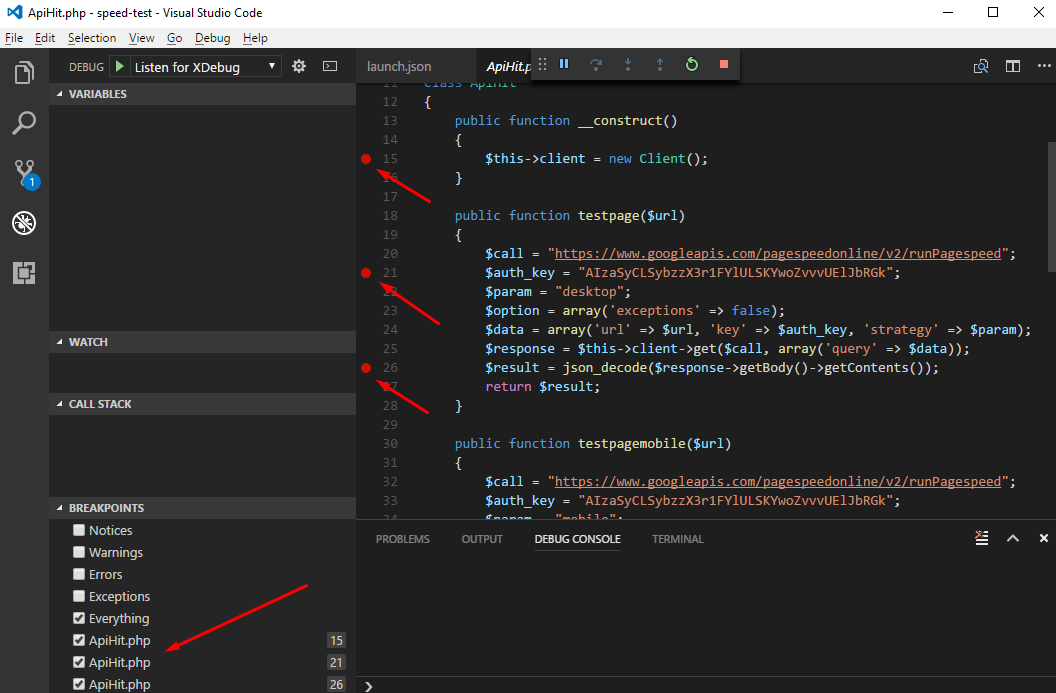
Step 5: Set Breakpoint and Debug
- Open a PHP file in your project
- Click in the gutter to set a breakpoint (red dot appears)
- Visit your site in browser
- PhpStorm will prompt you to accept the connection:
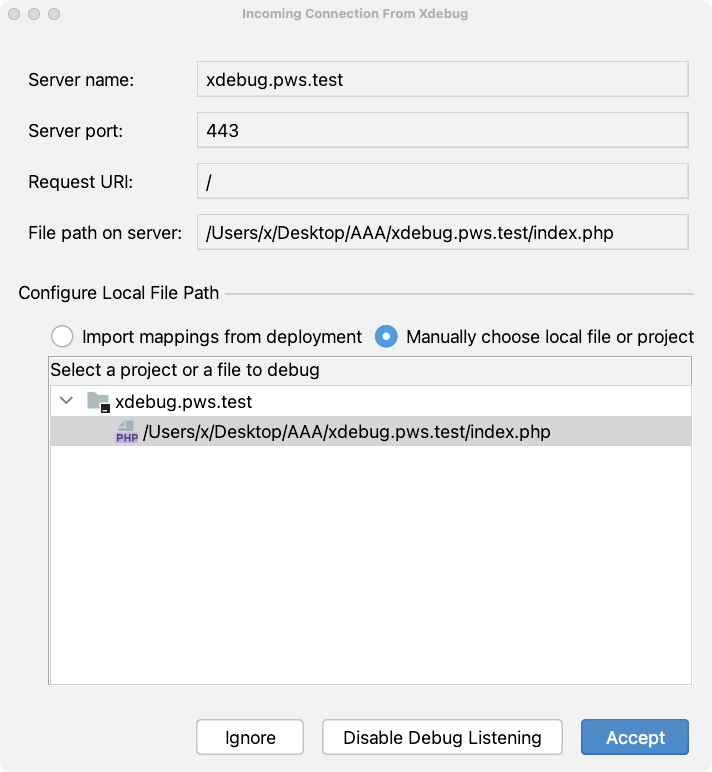
Click "Accept"—you're now in debugging mode:
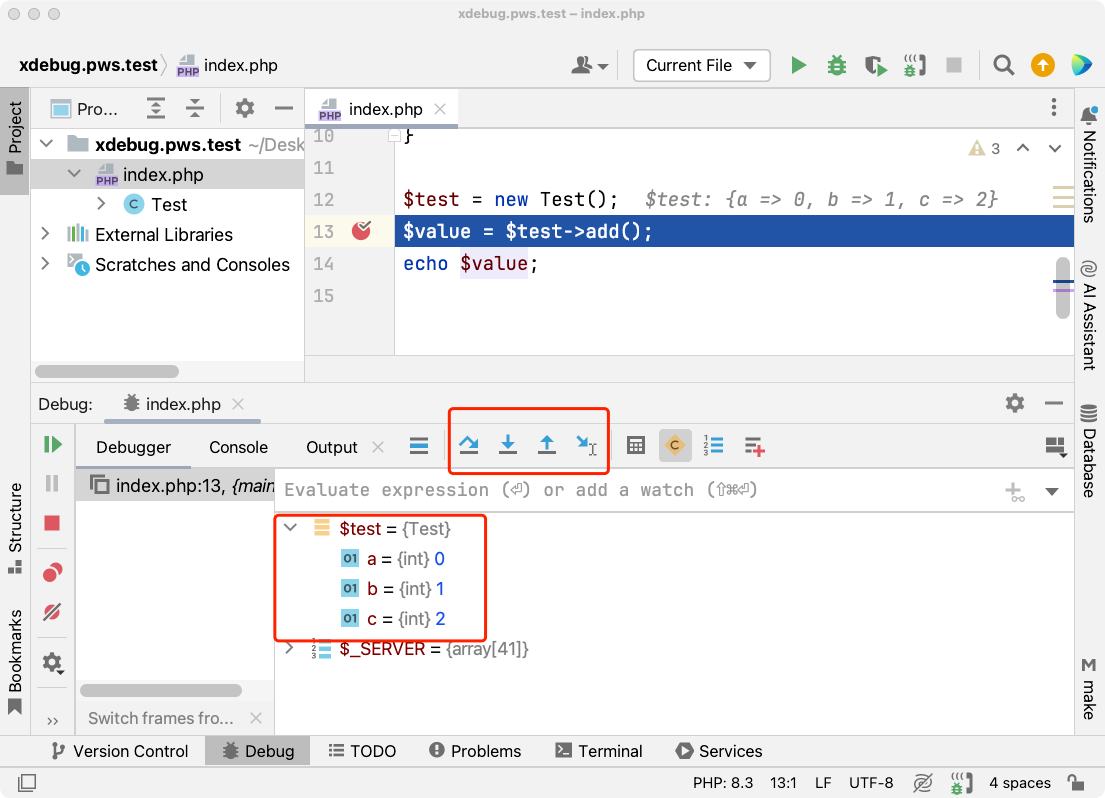
Debugger panels:
- Frames: Call stack showing execution path
- Variables: Inspect all variables in scope
- Watches: Track specific expressions
- Console: Execute PHP code in current context
VSCode Setup
Step 1: Install PHP Debug Extension
- Open Extensions view (Ctrl+Shift+X)
- Search for "PHP Debug"
- Install the extension by Felix Becker
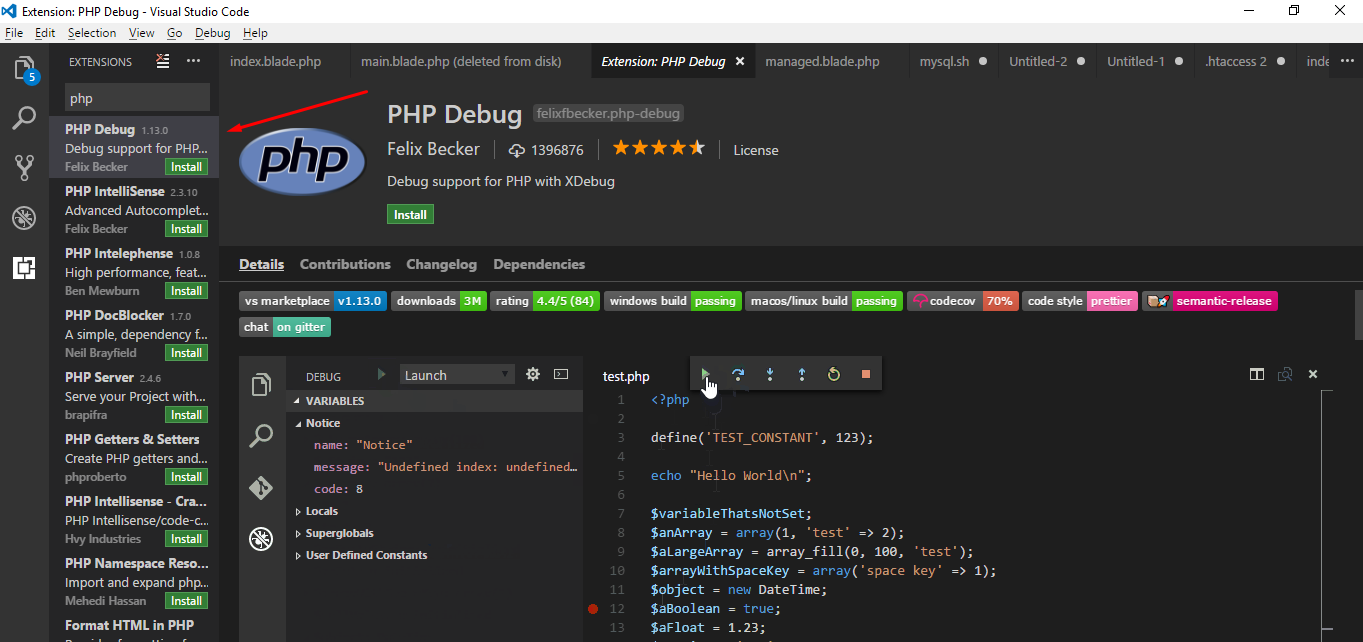
- Reload VSCode window after installation
Step 2: Add Debug Configuration
- Switch to Debug view (Ctrl+Shift+D)
- Click "create a launch.json file"
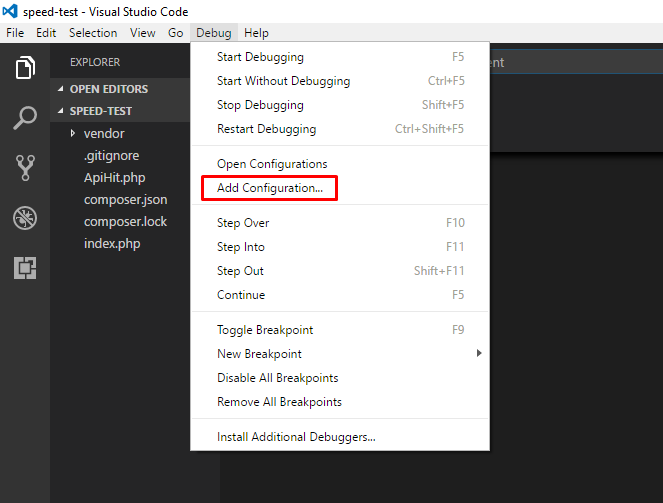
- Select "PHP" as the environment
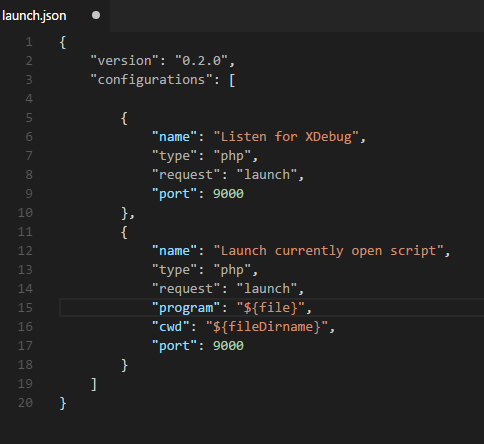
Step 3: Configure launch.json
VSCode creates .vscode/launch.json. Add the runtimeExecutable property pointing to your FlyEnv PHP:
{
    "version": "0.2.0",
    "configurations": [
        {
            "name": "Listen for Xdebug",
            "type": "php",
            "request": "launch",
            "port": 9003,
            "runtimeExecutable": "/Users/username/.flyenv/php/8.3.11/bin/php"
        }
    ]
}
Find your PHP path:
which php
# or
flyenv php path
Step 4: Start Debugging
- Click the green "Start Debugging" button (play icon)
- Set breakpoints in your code
- Visit your site in browser
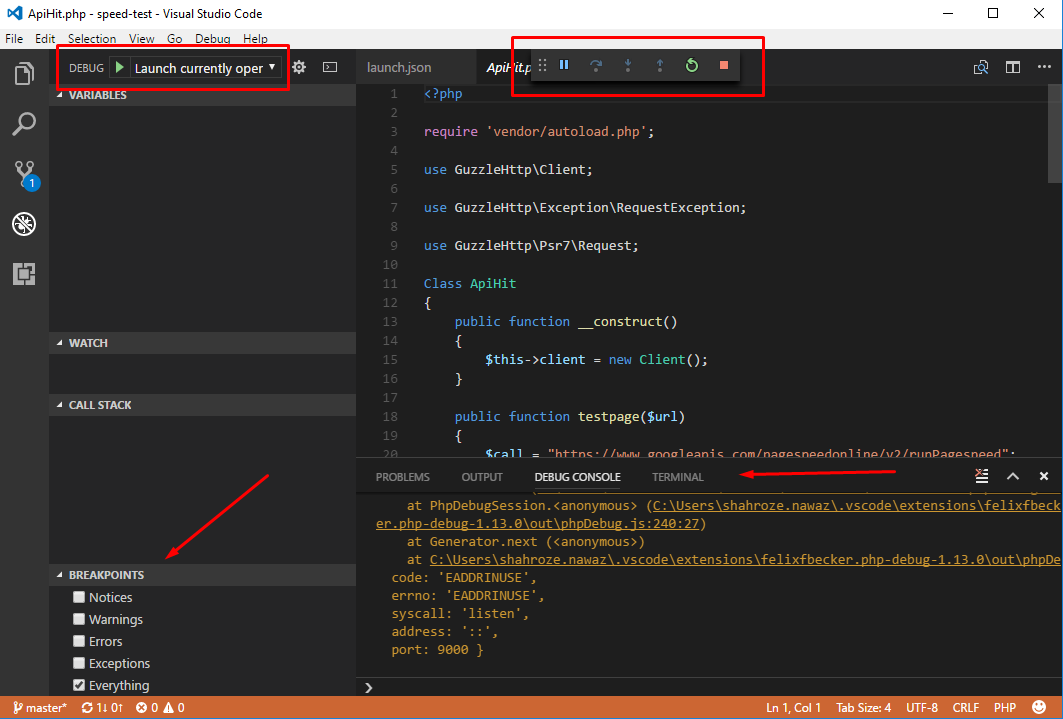
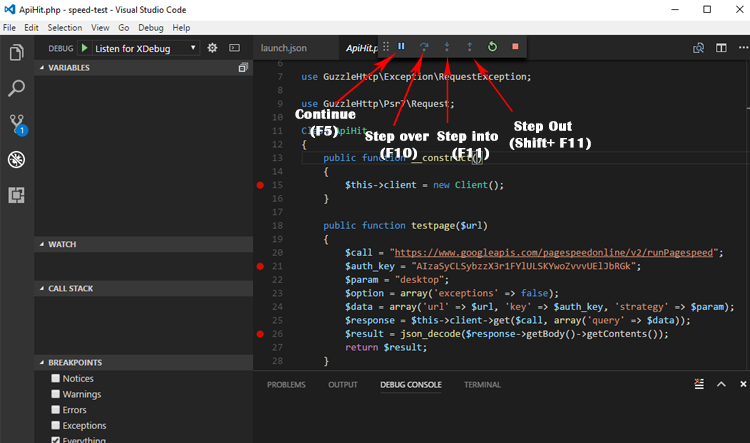
Step 5: Debug Controls
When a breakpoint is hit:
Debug Console shows variable values and execution details.
Keyboard shortcuts:
| Key | Action |
|---|---|
| F5 | Continue / Run to next breakpoint |
| F10 | Step Over (execute line, don't enter functions) |
| F11 | Step Into (enter function calls) |
| Shift + F11 | Step Out (return from current function) |
Essential Debugging Techniques
1. Conditional Breakpoints
Only break when specific conditions are met:
// Right-click breakpoint → More → Condition
$user->id === 123
$total > 1000
!empty($items)
2. Watching Expressions
Monitor specific variables or expressions:
$user->emailcount($cart->items)$request->input('search')
3. Evaluating Code
Execute PHP code during debugging:
// In PhpStorm Console or VSCode Debug Console
$user->refresh();
DB::table('logs')->where('id', 1)->first();
4. Stack Tracing
See how you got to the current line:
#0 app/Http/Controllers/OrderController.php(45)
#1 vendor/laravel/framework/src/Routing/ControllerDispatcher.php(48)
#2 vendor/laravel/framework/src/Routing/Route.php(262)
...
Click any frame to inspect variables at that point in execution.
Troubleshooting
"Xdebug not loading" in phpinfo()
Causes:
- Wrong extension path
- Version mismatch (TS vs NTS)
- PHP not restarted after config change
Fix:
- Verify
zend_extensionpath is correct - Check PHP error logs for loading errors
- Ensure PHP was restarted in FlyEnv
"Cannot accept external Xdebug connection"
Cause: Port mismatch or firewall
Fix:
- Verify port 9003 in both
php.iniand IDE - Check firewall isn't blocking localhost:9003
- Ensure IDE is listening before making requests
"Connection refused" or timeout
Cause: Xdebug can't reach IDE
Fix:
; Try these settings in php.ini
xdebug.client_host = 127.0.0.1
xdebug.discover_client_host = 1
xdebug.client_port = 9003
Debugging not starting
Cause: start_with_request setting
Fix:
xdebug.start_with_request = yes— Debug every request (development only)xdebug.start_with_request = trigger— Only when triggered (add?XDEBUG_TRIGGER=1to URL)
Breakpoints not hitting
Checklist:
- [ ] Path mappings configured correctly (PhpStorm)
- [ ] File on server matches local file
- [ ] Breakpoint is on executable line (not blank/comment)
- [ ] Xdebug mode is
debug(notprofileoroff)
Performance Profiling (Bonus)
Xdebug can also profile your code to find bottlenecks:
xdebug.mode = profile
xdebug.start_with_request = trigger
xdebug.output_dir = /tmp
Trigger profiling by adding ?XDEBUG_PROFILE=1 to any URL. Analyze results with:
- KCachegrind (Linux)
- QCachegrind (macOS/Windows)
- PhpStorm (built-in profiler)
Frequently Asked Questions (FAQ)
Q: Does Xdebug slow down my application?
A: Yes, by 10-50% when active. Only enable it for development, never production. Use xdebug.mode = off to disable without uninstalling.
Q: Can I use Xdebug with Laravel Sail?
A: Yes, but it's complex. With FlyEnv, Xdebug works natively without Docker networking complications.
Q: What's the difference between Xdebug 2 and 3?
A: FlyEnv installs Xdebug 3.x which has simplified configuration. Settings like remote_enable are replaced with mode = debug.
Q: Can I debug CLI scripts?
A: Yes. In PhpStorm, use "Run > Debug" on your script. In VSCode, configure a "Launch currently open script" configuration.
Q: Why use port 9003 instead of 9000?
A: Xdebug 3 changed the default from 9000 to 9003 to avoid conflicts with PHP-FPM which often uses 9000.
Q: Can I debug AJAX requests?
A: Yes. Xdebug works with any HTTP request—page loads, AJAX, API calls. Just ensure your IDE is listening.
Q: How do I debug only specific requests?
A: Change xdebug.start_with_request = trigger and add ?XDEBUG_TRIGGER=1 to URLs you want to debug.
Q: Can I use Xdebug with PHPUnit tests?
A: Absolutely. Set breakpoints in test methods or source code, then run tests with debugging enabled in your IDE.
Q: Does Xdebug work with PHP 8+?
A: Yes. Xdebug 3.0+ fully supports PHP 8.0, 8.1, 8.2, and 8.3 including new features like named arguments and attributes.
Summary
Xdebug + FlyEnv gives you professional PHP debugging:
- ✅ One-click installation on macOS/Linux
- ✅ Pre-configured templates in FlyEnv
- ✅ Step-through debugging in PhpStorm and VSCode
- ✅ Variable inspection and expression evaluation
- ✅ Call stack tracing for complex applications
Stop guessing what your code does. Start seeing it.
Download FlyEnv — Available for macOS, Windows, and Linux
Related guides:
- Run Laravel with FlyEnv — Laravel-specific setup
- Project-Level Version Isolation — Manage multiple PHP versions
- PHP Extensions Installation — Other useful extensions